Table of Contents
- Introduction: Why Analytics Matter in Internal Comms
- What’s New in Diggspace Analytics
- Unified Analytics Dashboard
- Article Analytics
- Channel Analytics
- Author Analytics
- Interactive Trends & Exportable Data
- Turning Data into Action
- Optimize Content Strategy
- Time Your Communications
- Boost Underperforming Areas
- Encourage Key Contributors
- Support Leadership Communication
- Seamless Integration and Accessibility
- Ready to Get Started?
Introduction: Why Analytics Matter in Internal Comms
At Diggspace, we know how important data is for your internal communications strategy. Our platform’s analytics have always aimed to help understand how content is impacting users. Today, we’re thrilled to announce a major upgrade: Diggspace’s content analytics features have been completely revamped to give deeper, more actionable insights into internal engagement.
We listened to our clients feedback that the old analytics weren’t as consistent or clear as they could be. In response, we’ve rebuilt the analytics experience from the ground up for better clarity, consistency, and strategic insight.
The result? A unified analytics dashboard that is more useful and easier to interpret – so you can see exactly what’s working, where users are engaging, and how content is influencing internal communication across the organization. Whether you’re a content creator or a communications manager, the new analytics will help make better decisions backed by data.
What’s New in Diggspace Analytics
Our latest analytics overhaul introduces a host of improvements and new capabilities. Here are some highlights of what’s new:
- Unified Analytics Dashboard: All your key content metrics are now available in one place. The dashboard is organized into three focus areas – Articles, Channels, and Authors – allowing you to analyze performance from different perspectives at the click of a tab. Improved labeling and design make it immediately clear what each number represents, eliminating confusion and giving you a consistent view of engagement data.
- Article Analytics: Drill down into the performance of every article you publish. For any time range you choose, see how many views it received, how many unique users (reach) read it, and the engagement it sparked (likes and comments). You can quickly identify which posts are resonating most with your employees and which ones might need a different approach.
- Channel Analytics: Compare engagement across different channels (departments, topics, or team spaces) to spot trends in where your users are most active. For example, you can contrast a “Company News” channel versus a “Policy Updates” channel to see which generates more views and discussion. Channel Analytics also shows how many articles and contributors each channel had in the selected period, so you can gauge content activity in each area of your intranet.
- Author Analytics: Measure the impact of content creators in your organization. See who published the most content and who garnered the most views, reach, likes, and comments on their articles. This feature helps identify your key communicators and subject matter experts. For instance, you might discover that posts from a leadership figure (e.g. your CEO) get unusually high engagement – insight you can use to encourage more top-down communication. Author Analytics can even be a fun way to recognize prolific contributors or spark friendly competition on who’s creating the most engaging content.
- Interactive Trends & Exportable Data: The new analytics includes interactive graphs and handy export options. Use the time-series graph to track views, reach, likes, and comments day-by-day, helping you pinpoint when your users are most active and the best times to post updates. All analytics pages let you filter data by date range (and by channel or author where applicable) for flexible analysis. When you need to share results or do deeper analysis, you can export the metrics to Excel with one click, generating a report of all the data on screen for further crunching or presentation.
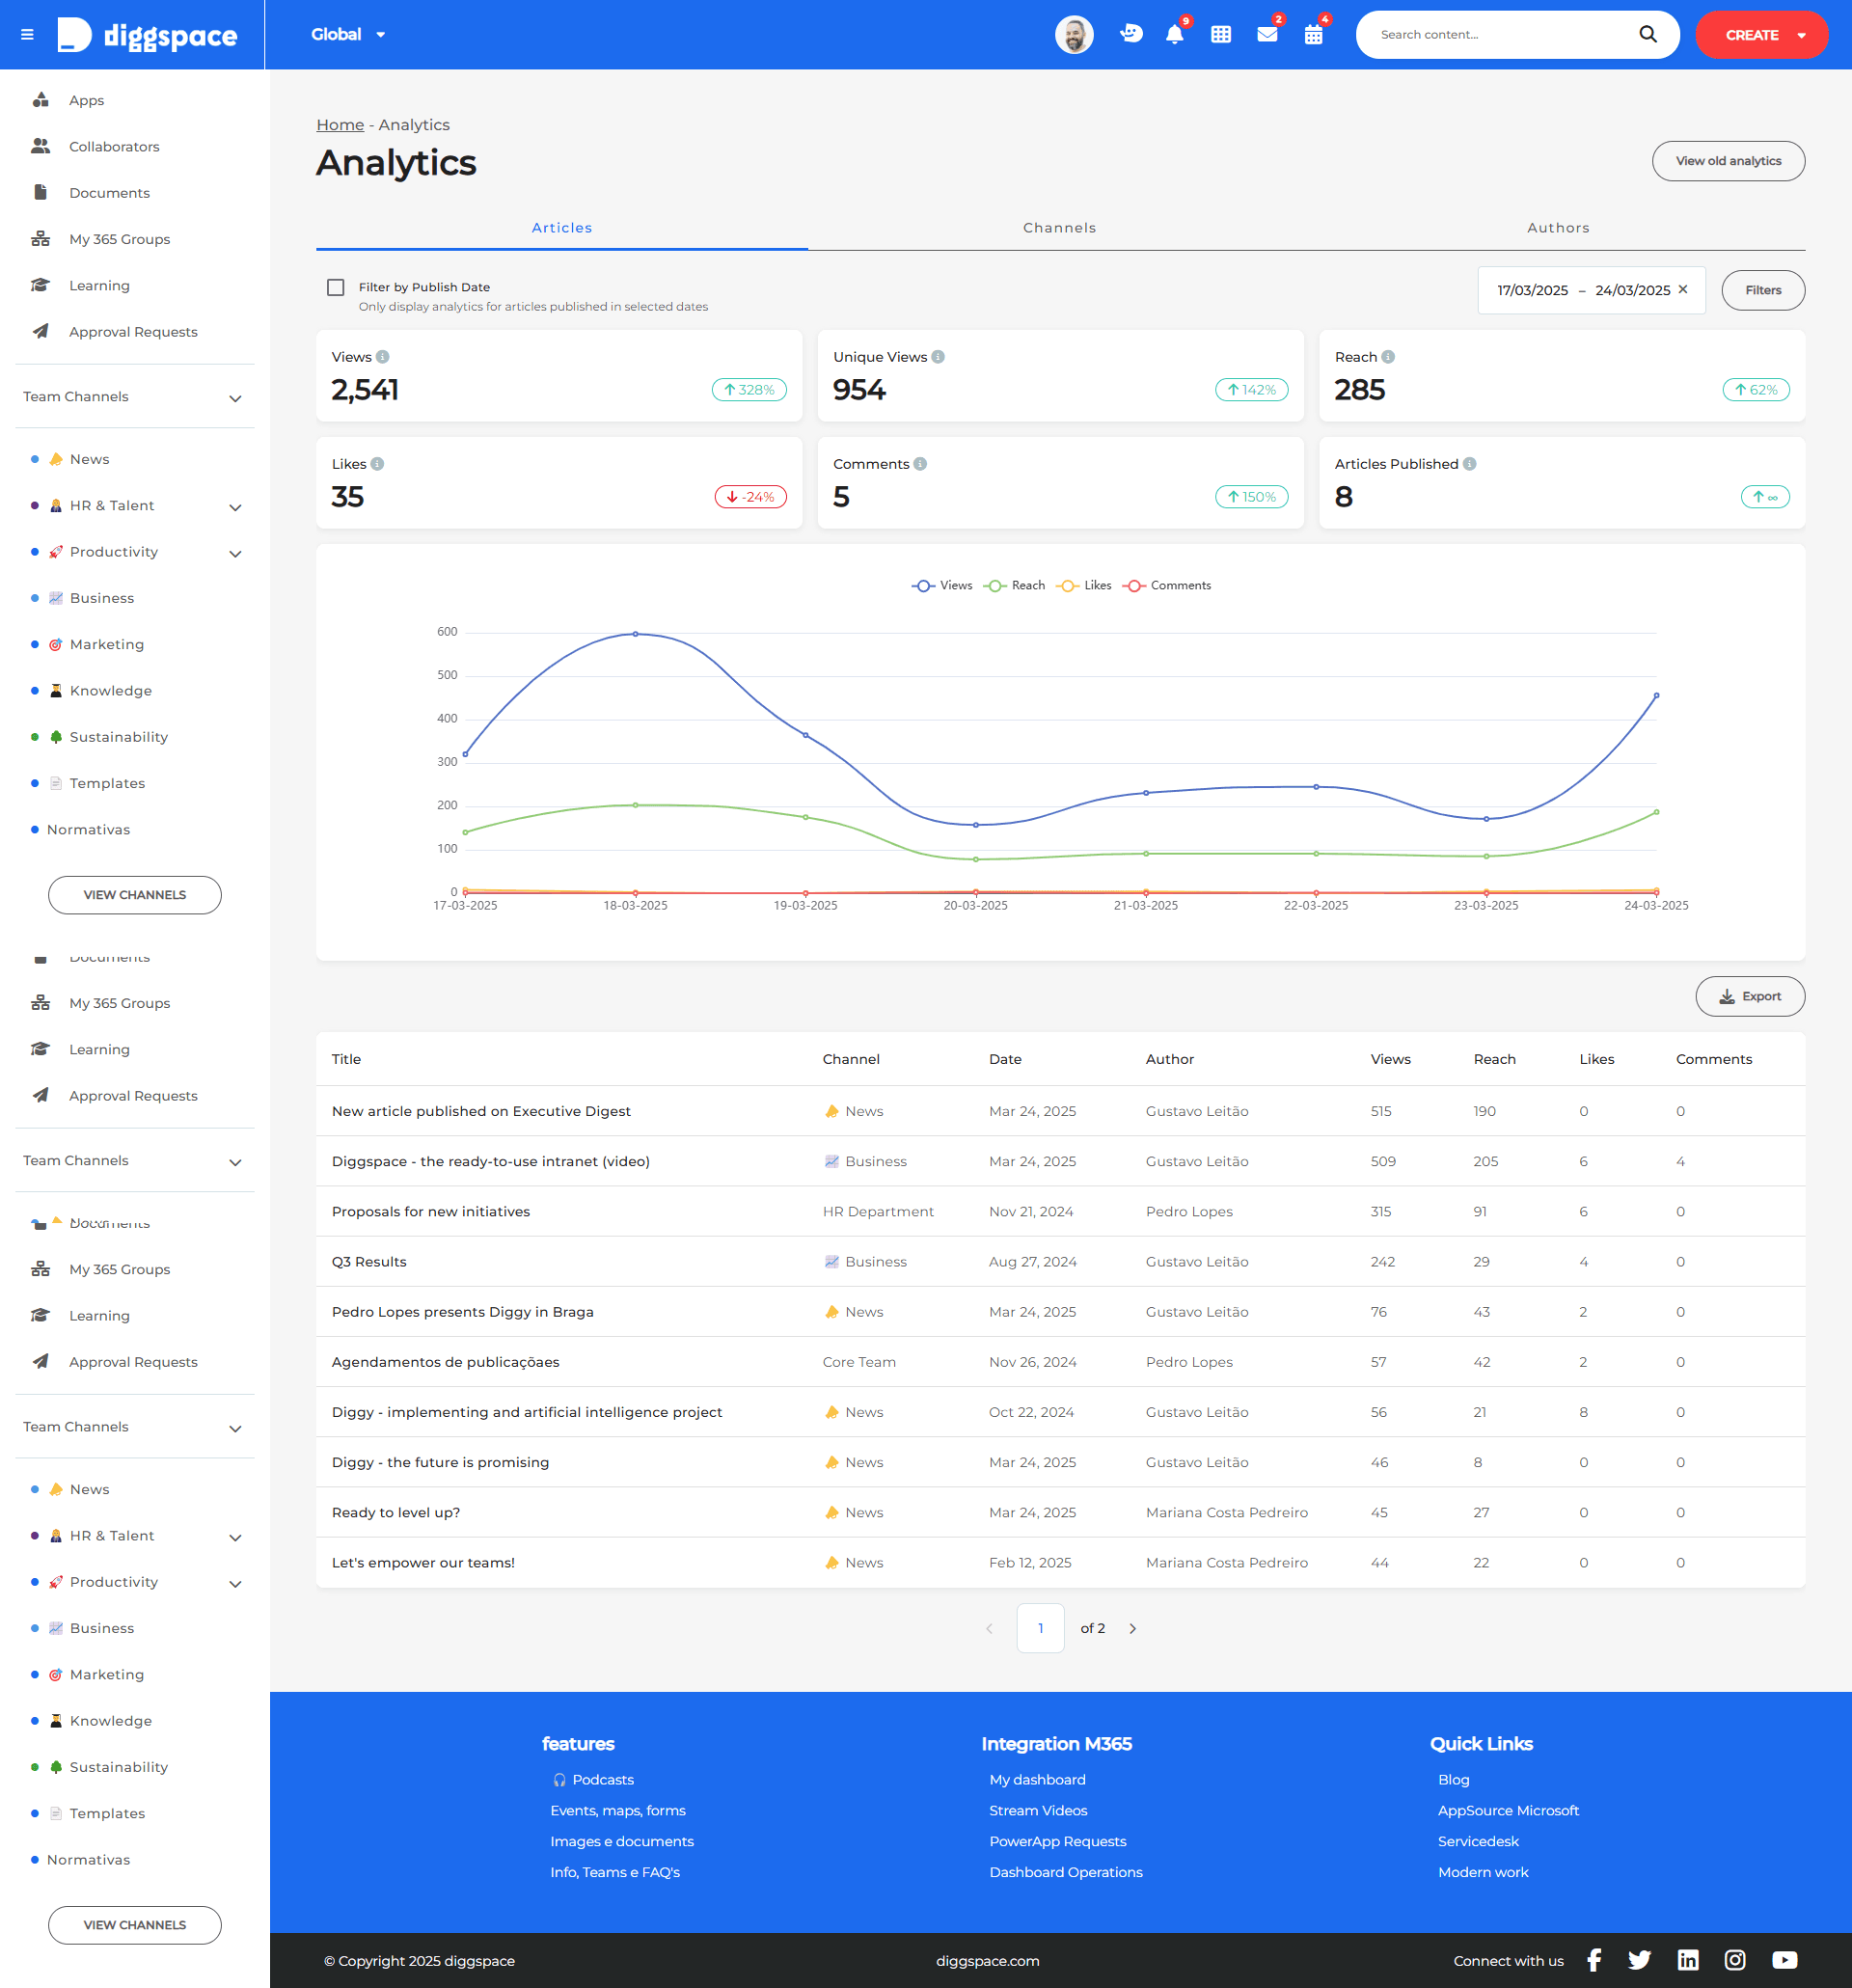
The new Diggspace Analytics dashboard provides a comprehensive overview of content performance at a glance. In the Articles view (shown below), you get summary cards for total Views, Reach (unique viewers), Unique Views, Likes, Comments, and Articles Published within your selected timeframe, all updated in real-time. An interactive line graph plots these metrics over time, so you can immediately see spikes and trends in engagement (for example, identifying which days had peak activity). This clean, unified interface makes it easy for any team member to understand how your intranet content is performing and where to focus next.
Turning Data into Action
Numbers alone don’t drive change – but the insights you gain from them certainly can. Diggspace’s revamped analytics are designed to inform your content strategy and help you take action to improve internal engagement. With clear evidence of what content works best, you can refine your approach to communication in many ways:
- Optimize Content Strategy: Identify the topics and formats your employees engage with most. If analytics show that interactive posts or videos consistently get more likes and comments than text-only announcements, you can adjust your content mix accordingly. Or, if a certain type of article isn’t getting much traction, you might reconsider how it's written or promoted.
- Time Your Communications: Use the daily engagement graphs to determine when your workforce is most active on the platform. For example, you might notice a spike in views every Tuesday morning. Armed with that knowledge, you can schedule important news on Tuesdays to maximize reach. Conversely, if Fridays show a dip in activity, you may avoid releasing critical updates at week’s end.
- Boost Underperforming Areas: Compare channels and discover where engagement might be lagging. If an important channel (say, “HR & Talent”) has lower views, the data can prompt a discussion on how to boost its visibility – perhaps by encouraging managers to highlight HR content or by merging less active channels into more popular ones. Data helps you pinpoint exactly where to focus your outreach efforts.
- Encourage Key Contributors: With Author Analytics, you can spot who your communication champions are. Perhaps your data shows one department’s posts consistently receive high engagement – you could leverage this by asking that team to share their best practices or by having them mentor other content authors. On the flip side, if you want to promote user-generated content, you could create a leaderboard of top contributors to recognize and motivate employees to share more.
- Support Leadership Communication: The analytics might reveal that leadership-authored articles (like the CEO’s monthly message) see a far greater reach and repeat views than other content. That’s a strong signal to continue executive communications and maybe even increase their frequency or visibility, knowing they are effective at engaging the whole organization.
In short, these analytics turn raw data into a story about your internal communications. They help you celebrate what’s working and troubleshoot what isn’t, with concrete numbers to back decisions. By acting on these insights, you can foster a more informed, engaged workplace where every post and announcement has purpose.
Seamless Integration and Accessibility
One of the best parts about Diggspace Analytics is that it’s built right into the platform you already use – no need for any external tools or complex setup. Accessing the new analytics is simple and intuitive. Just open your user menu and click on Analytics, and you’ll be taken to the new dashboard with the Articles, Channels, and Authors tabs ready to explore. You can also jump straight to analytics from any specific page – for instance, when viewing an article or a channel, click the chart icon in the header to see analytics for that item instantly.
Diggspace respects your existing permission levels to ensure data is seen only by those who should. Analytics access is tiered based on roles:
- Global Admins and Content Admins can view analytics for all content across the portal.
- Channel Admins/Editors can view analytics for the channels they manage.
- Content Authors can view the analytics for their own articles.
This way, every user gets relevant insights: individual authors see how their posts are doing, while administrators get the big-picture metrics. It’s analytics for everyone, without compromising security or privacy.
For our longtime users, please note that the new analytics system begins tracking data from December 21, 2024 onward. You’ll still be able to access your legacy analytics data (from before that date) for a while using the “View old analytics” option at the top of the Analytics page. We’ll let you know before retiring the old analytics, but we’re confident the revamped version will far better serve your needs going forward.
Ready to Get Started?
The revamped analytics features are live now for all Diggspace users. We encourage you to dive in and explore your new Analytics dashboard to start gaining deeper insights into your intranet content. This improvement is a direct result of feedback from our valued customers – we truly appreciate your ideas that help make Diggspace better for everyone. As always, we’re eager to hear what you think of these updates, so don’t hesitate to share your thoughts and suggestions.
If you’re not yet using Diggspace, there’s never been a better time to join. Our platform now not only helps you create and share content effortlessly, but also measure its impact in detail. Book a demo with us to see Diggspace’s new analytics in action, and learn how a data-driven approach can elevate your internal communications and employee engagement. Here’s to making more informed decisions and building a more connected workplace with Diggspace!
Ready to revolutionize your company's internal communication?
Start exploring the possibilities with Diggspace today.
Let's start a conversation, share more insights to future-proof your workplace.